

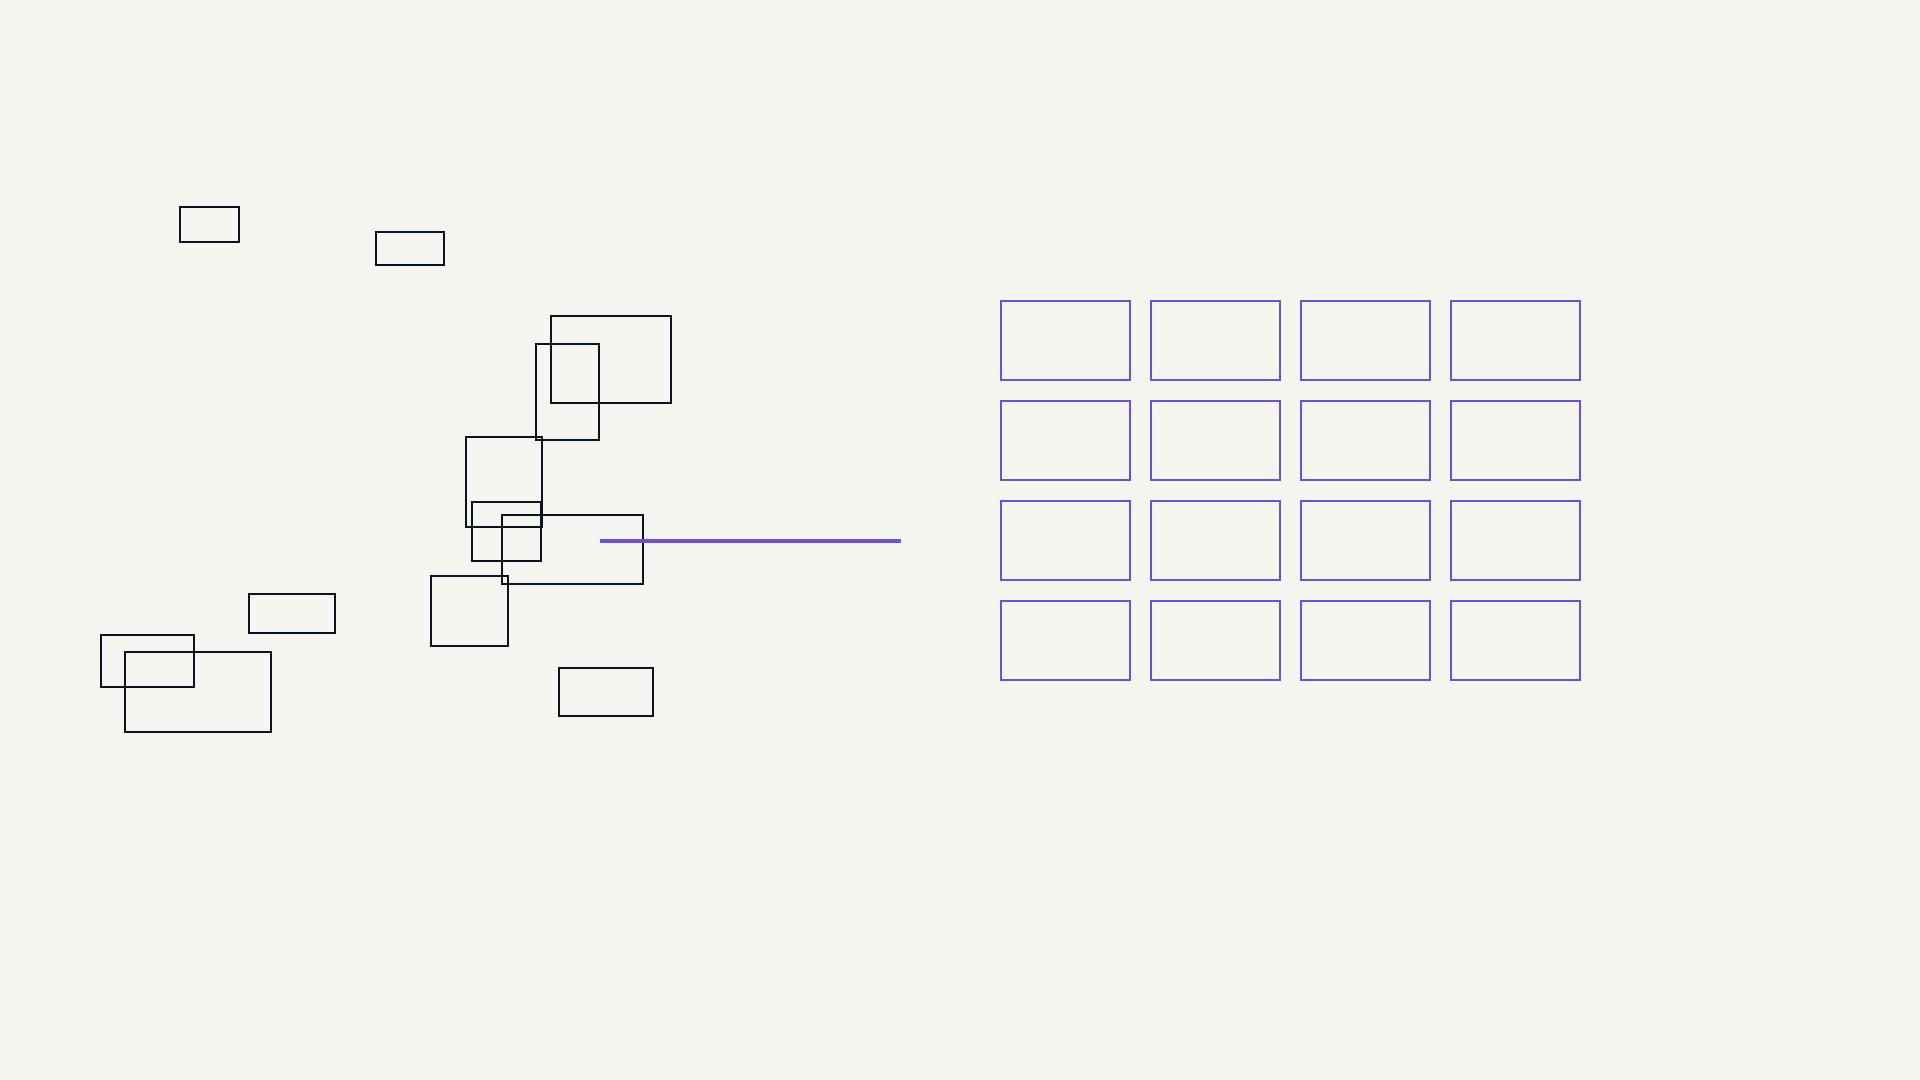
A lender with fifty portfolio companies is, in practice, receiving fifty different versions of a monthly financial package. Some arrive as clean Excel exports from a modern ERP. Others arrive as a PDF export from QuickBooks with line items labeled in a way that only the company's own controller would recognize. Monitoring a portfolio well requires turning all of that into a single, comparable dataset, and that work is far less glamorous than anything else in credit, which is exactly why it gets underinvested in.
Why comparability is the actual hard problem
The challenge is not reading any one company's financials. It is reading fifty companies' financials and answering the question "how does this quarter compare to last quarter, across the whole portfolio" without an analyst manually mapping every company's chart of accounts to a common structure every single reporting cycle.
Where reporting formats diverge
A few patterns show up repeatedly across portfolio companies.
- Different fiscal year ends, which makes trailing twelve month comparisons across the portfolio nontrivial without normalization.
- Inconsistent EBITDA add-back treatment, where one company includes a management fee add-back and another does not, even though both are contractually permitted to.
- Line-item labeling that varies by industry and by which accounting system the company happens to use.
- Reporting cadence that differs by loan agreement, so some companies report monthly, others quarterly, on different days of the month.
How normalization actually works in practice
A workable normalization process maps every incoming report to a common internal schema, rather than trying to force portfolio companies onto a single external template, which is rarely realistic given how many different stakeholders each company already reports to.
- Extract the raw line items from whatever format arrives, whether structured spreadsheet or scanned PDF.
- Map those line items to a standard internal chart of accounts, using both the company's own history and sector-level patterns to handle ambiguous labels.
- Apply the credit agreement's specific EBITDA and covenant definitions to the normalized data, since two portfolio companies in the same fund can have different contractual definitions.
- Flag anomalies, such as a line item that maps differently than it did the previous quarter, for a human reviewer rather than silently accepting the change.
The payoff is comparability, not just speed
Speed matters, but the larger benefit is being able to ask portfolio-wide questions that were previously impractical: which companies are trending toward a covenant breach over the next two quarters, which sectors in the portfolio are showing margin compression, which companies' reporting has become less reliable over time. None of those questions can be answered from fifty separate PDFs sitting in fifty separate folders.
A portfolio you cannot compare across is not being monitored. It is being filed.
What this changes for the monitoring team
Once normalized data exists, the monitoring team's job shifts from data entry to actual analysis. Trend deterioration that would have been visible only in hindsight, after a covenant breach forced a closer look, becomes visible a quarter or two earlier, when there is still time to have a constructive conversation with management or a sponsor.
Where we see this going
The next step beyond normalization is prediction: using the consistent historical data across a portfolio to flag which credits are statistically likely to need attention before their own reported numbers show it clearly. That only works once the underlying data is comparable in the first place, which is why normalization, unglamorous as it is, remains the foundation everything else in portfolio monitoring is built on.